
Human Skills in the AI Era: Why EI & Leadership Training Matter More in Australia & NZ (2026)
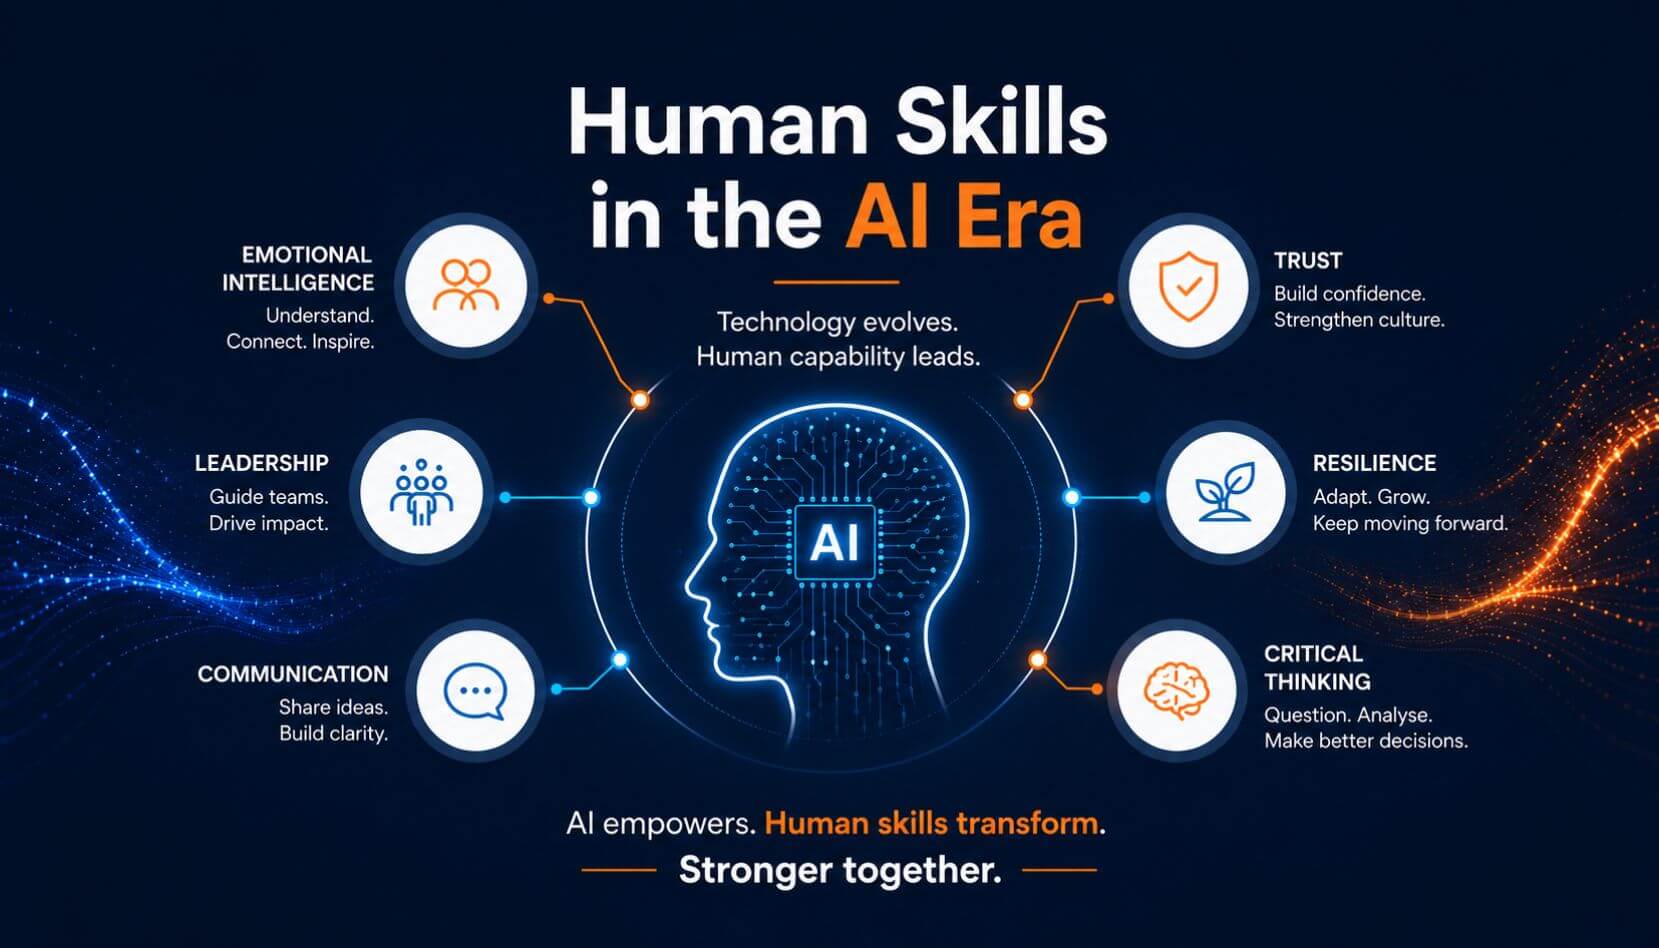
In the rush to adopt AI tools, many organisations are discovering that technology alone doesn’t deliver results. The real advantage now lies in human skills emotional intelligence, adaptive leadership, resilience, and the ability to lead people through rapid change.